Elevate Your Marketing Game: Essential Email Metrics Every Medical Marketer Should Master

When it comes to healthcare marketing, email is a proven and powerful tool for reaching your audience. But how can you tell if your email campaigns are actually working? Tracking, analyzing and understanding your campaigns’ metrics is essential for success — and knowing how to use them can help you optimize your marketing efforts. MMS is in your corner.

Why Metrics Matter
Tracking key metrics is crucial for several reasons:
Performance evaluation
Metrics provide concrete data on how well your campaigns are performing.
Optimization opportunities
By identifying weak points, you can make targeted improvementsto your campaigns.
Audience insights
Insights into your audience’s preferences and behaviorsare invaluable.
Resource allocation
Understanding which campaigns are most effective can help youallocate your marketing budget more efficiently.
Competitive benchmarking
You can compare your metrics to industry standards to see howyou stack up against competitors.

NOWW Metrics for Email Campaign Effectiveness
Not all metrics are the same. Knowing the purpose and implications of each type can help you make the most of them, so you can drive better results. Our groundbreaking NOWW Platform can help. Below are some of the key metrics that NOWW delivers, so you can quickly and easily target, tailor, test and measure the results of your email broadcasts — all from your desktop.
Open rate %
The percentage of recipients who open your email.
Click to open %
The percentage of recipients who opened and then clicked on a link or image in the email.
Click-through rate %
The number of people who clicked a link in your email divided by how many people saw it.
Received
The total number of sent messages minus hard and soft bounces.
Read rate %
The percentage of recipients who downloaded and viewed an image or opened the email message.
Clicks
The number of recipients who clicked any tracked hyperlink in the mailing. Only one click is counted per recipient.
Delivered
Total number of sent messages minus the hard and soft bounces.
Email clients
Identification and insight into the recipients and top devices being used, such as iPhone®, Gmail™, Yahoo and more.
Opens
The number of times a recipient downloaded and viewed a mailing’s images or clicked on any links in the mailing. Includes multiple opens by the same recipient.
Opt-outs
The total number of recipients who have clicked the opt-out link and do not wish to receive further email communication from the sender.
Replies
The percentage of sent emails that generate a reply.
Read environments
Determines whether a mailing was viewed on a desktop computer, mobile device or webmail.
Sent/bounces
Sent measures the number of recipients your message was sent to. Hard bounces are messages that cannot be delivered to the email address. Soft bounces include messages that cannot be delivered due to full mailboxes, network errors, DNS errors and timeouts. Mail sent to these addresses might succeed again in the future.

Track key metrics with the NOWW Platform
Put MMS in your Corner
Not sure where to begin with all of these metric types? With our NOWW Platform, you can choose from a selection of Med-E-Mail analytics reports to track your success at the individual and aggregate levels. This includes the ability to track key metrics such as real-time metrics, engagement reporting, subject line testing, optimal sending time, etc. Below are the reporting types that Med-E-Mail delivers:
1. Aggregate email broadcast reports
These reports measure opens, click-throughs, sends, suppressed, hard bounces and soft bounces — providing a net deliverability rate. Digital engagement measures time spent viewing messages, platforms and top devices used.
2. Lead-scored prospects/phone follow-up reports
By building on standard reports but diving deeper, these reports provide measurements and lead-quality scoring of highly interested recipients with phone numbers. They’re beneficial to recruiters for finding and reaching out to the most qualified and interested prospects.
3. Enhanced engagement reports
These specific reports provide a detailed look at an individual recipient’s National Provider Identifier (NPI) number and/or medical education (ME) number level and recipients’ actual behaviors.
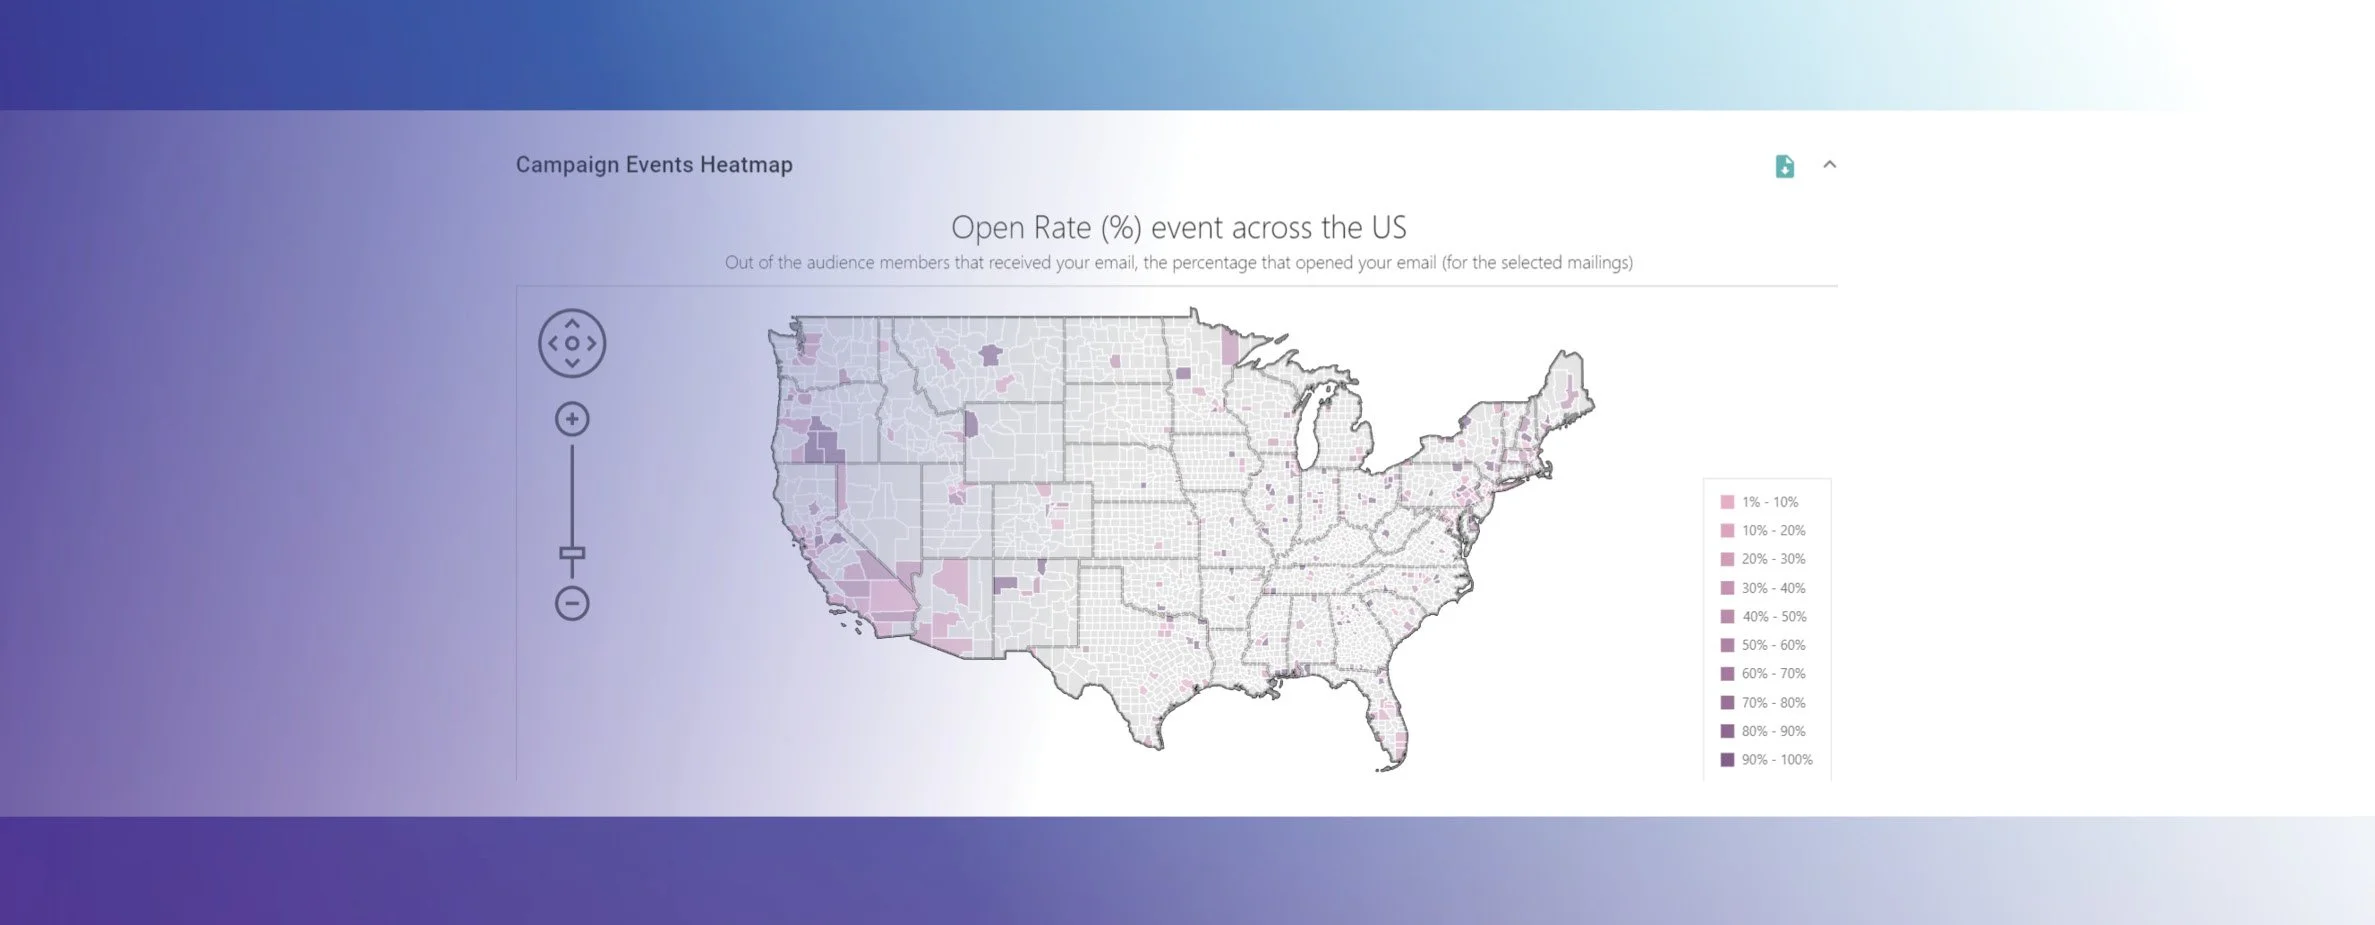
Campaign Heatmap Reporting
4. Engagement heat maps
Heat maps show top-performing states where emails have been opened, clicked and viewed to help you analyze your results. Individual mailing results and overall campaign results can be viewed in any completed campaign.
Data visualization for geographic analysis
Geographical heat map analysis illustrates data distribution across different geographic locations.
5. NOWW Broadcast Intelligence
A dynamic key performance indicator (KPI) dashboard allows users to view engagement trends and gather insights to improve email strategies. Common KPIs include service lines, provider specialist engagement, subject line engagement, time of day, best day, etc. Features include:
Best day to send
The most optimal day of the week to send emails and increase engagement. Wednesday and Thursday tend to be the highest-performing days for email campaigns across many industries.
Top/bottom subject lines
The highest and lowest performing subject lines based on open rates.
Viewing engagement
Opens based on where the read rate can be determined, including the top devices used.
Real-time reporting
Shows how well an email campaign is performing in real time. This can be an individual mailing campaign or a campaign with resend mailings. Mailing metrics captured include engagement deliverability rates, distinct recipient engagement, click-to-open rates, open rates, click rates, bounces and opt-outs.
6. Engagement comparison reporting
This reporting analyzes and compares engagement metrics across different time periods, platforms, campaigns and content types.
Average read engagement
This data is captured by a tracking link when a recipient downloads and views an image or opens the email message.
Conclusion
By focusing on these key metrics and implementing strategies to improve them, you can significantly enhance the effectiveness of your email campaigns. Remember, the goal isn’t just to improve numbers but also to create more engaging, valuable experiences for your audience that ultimately drive real business results. Leverage the NOWW Platform as a complete, cloud-based medical marketing toolbox to better manage and maximize your email with ease.
Contact us today to get started.